In 2020 and 2021, I tracked a ton of personal stats, ranging from exercise habits (basically a habit tracker), expenditure, food intake, mood, entertainment/music binges and so on.
For both years, I used my own Google Sheets template. Recently, a few friends slid into my DMs for a template, so I eventually made a clean one that I can share!
When you click the above link, you'll be redirected to Google Sheets. Make a copy (File → Make a Copy) to save your own template in your Google Drive.
Filling up the spreadsheet
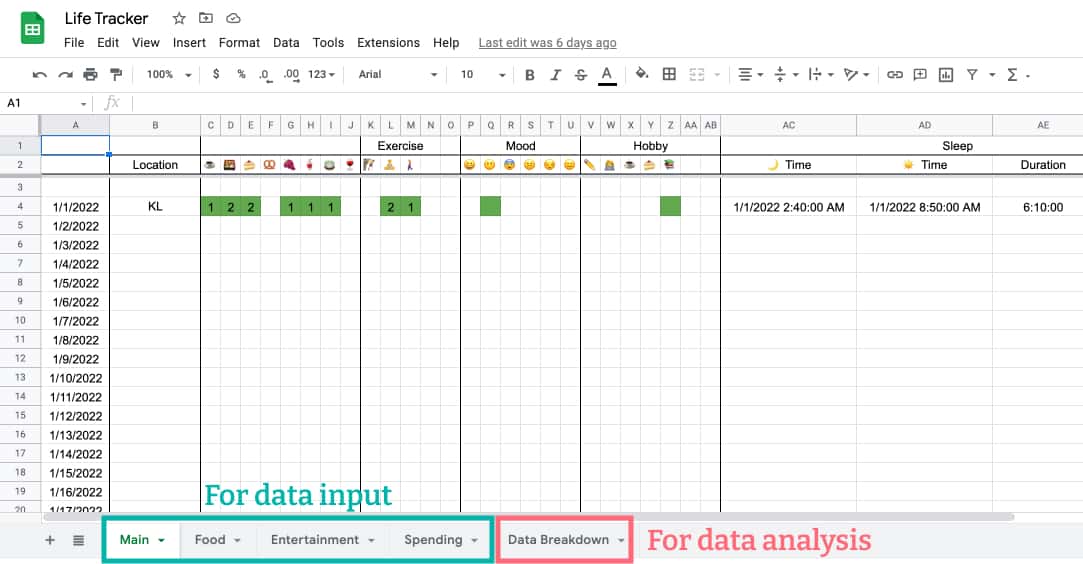
There are multiple tabs for each category: Main (Habits), Food, Entertainment and Spending.
The Data Breakdown tab is where all the data is aggregated based on data you've filled in the Food and Entertainment spreadsheets, so you don't have to fill up anything in the Data Breakdown spreadsheet.
I also filled in dummy data for each spreadsheet to give an example.
In the Main spreadsheet, you can track any stat you want—just change the emojis and make sure you remember what those emojis represent! 😄
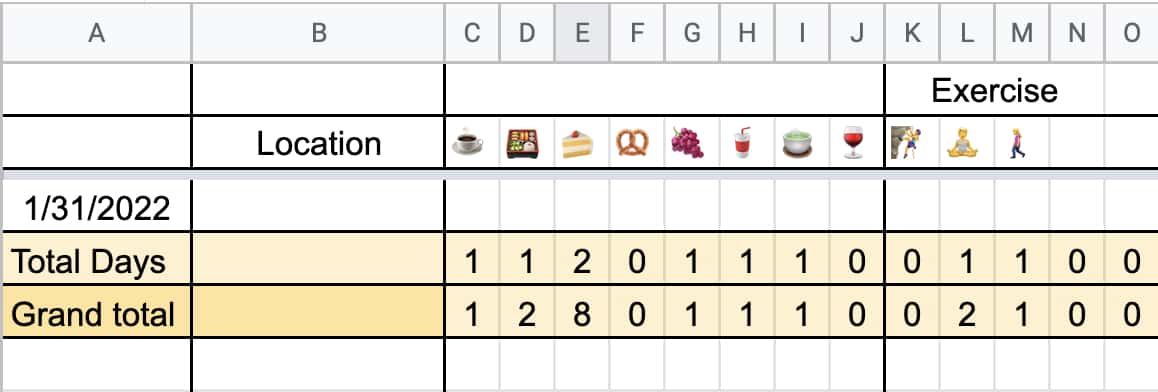
There are two lines at the end of each month. The figures in the first line are the number of days you've done a particularly habit, while the figures in the second line are the total number of times you've done the habit (if for example, you did something 2-3 times a day).
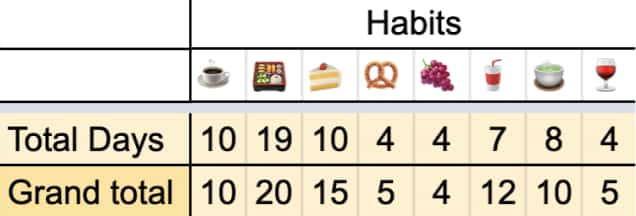
So in the example above, assuming that these are my totals for January, you can quickly see:
- I ate desserts (🍰) 10 out of 31 days
- Ate 15 servings of desserts
- That is an average of 0.48/month (count yourself).
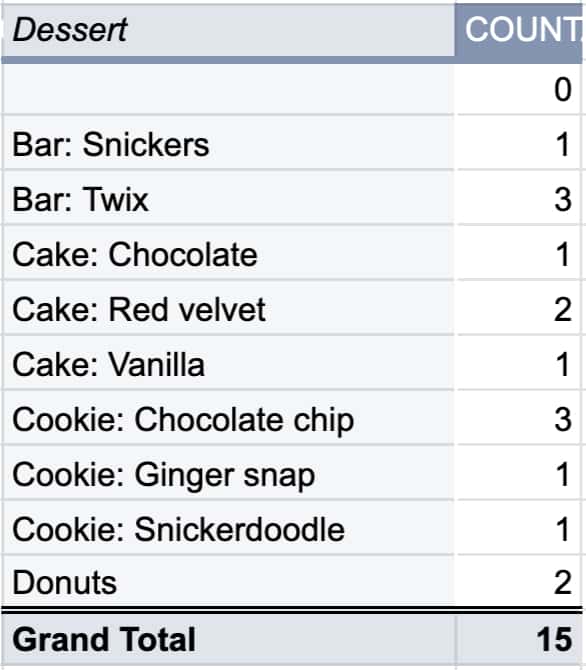
And if you decide to fill up the individual items under the Dessert column in the Food spreadsheet, you'll see an aggregation of the data in the Data Breakdown tab for Desserts.
What should you track?
Anything, really. For me, there are 3 aspects:
Practical or for life improvement. For example, being active is important to me so tracking exercise habits is a must. I've always been a sucker for desserts or junk food—I track this data so that I can shame myself at the end of each month.
Fun. Just a stat which is kinda cool or can be used as a fun tidbit to talk about. Like "Oh, I cooked a total of 203 days in 2022!".
Funny aka completely useless. In 2021, I tracked the number of days I have a canker sore, because I just kept getting them and I needed to know. The answer is 64 days. That's about 1/6 of the year! 😭
Why use this spreadsheet and not an app?
I want to own the data. With habit, expenditure or food tracker apps, data is contained within the app and I most likely have to pay to export my data into a CSV file... and then I'm stuck with an ugly CSV file. I thought that it was just better with a Excel spreadsheet that I'm happy to see every day.
I wanted some flexibility of the type of data I can put in. If I was just tracking one aspect (habits OR food OR music), choosing an app would be sufficient. But I wanted various data and it was easier to create a new spreadsheet for each data that I'd like to track vs manually adding data for 5 different apps.
It's much easier for me to catch dirty data input.
I'm more of a desktop/laptop person than a phone person.
The only con is if you're trying to create graphs at the end of the month or year, you'd have to manually create them 😄
What works?
Anything that can be answered with a yes/no is great with the spreadsheet. Did I do a workout today? Did I work on a hobby? Did I (not) drink caffeine today?
Tracking data that have categories. For example, fill out the shows in the
Entertainmentspreadsheet and the pre-made pivot table in theData breakdowntab will tell you how many episodes of series or movies you've watched automatically. It'll also tell you what is your preferred genre for the year (not that you won't know yourself 😄).
Similarly, for theFoodspreadsheet, I can know the number of times I've eaten out or ordered food delivery, and the type of cuisine I'm partial towards.
What doesn't (really) work
Mood tracking
Mood tracking is a bit tricky, since it's only one mood assigned for the whole day. It can also be quite skewed, especially if I'm filling it up in the beginning of the day. E.g. always sad or jaded before work 🤣
There are mood trackers out there that allow you to either...
- track your mood multiple times a day for higher accuracy, or
- give a rating from 1-5 for the day.
I like the latter as you can eventually look back and see how many 1-rated days and explain the reasoning. Either of these methods is also doable with Google Sheet but I did not implement it because I'm not too interested in this stat in general.
Expenditure
Expenditure is sometimes a pain in the ass to fill out. It's also the stat that has the highest probability of missing data. I do try to fill up almost everything but there will always be some that will fall through the cracks.
For example, in my case, my sister pays for some things in advance and takes the money out of a shared fund. I don't usually check the transactions for this fund so there could be an item missing.
You're probably better off getting an expenditure app that you can connect to your bank or something.
Music
I track this data because my listening habit is 'binge listening' i.e. I almost always listen to a whole album of an artist in one go. So my stats show me that I binge-listened to x artist for x days. This won't work if you prefer to listen to playlists or a mix of artists every time.
Sleep
Excel/Google Sheets is just weird with times and dates man, especially when trying to find averages. It could just be my incompetence with Excel but I swear I google like 5 different time/date formulas every time. My advice? Just use a sleep tracking app or invest in a smartwatch that tracks your sleep automatically.
Supplementing with other apps
There are some other apps that I use and they come with their own 'Wrapped' at the end of the year.
Spotify & Last.FM for music
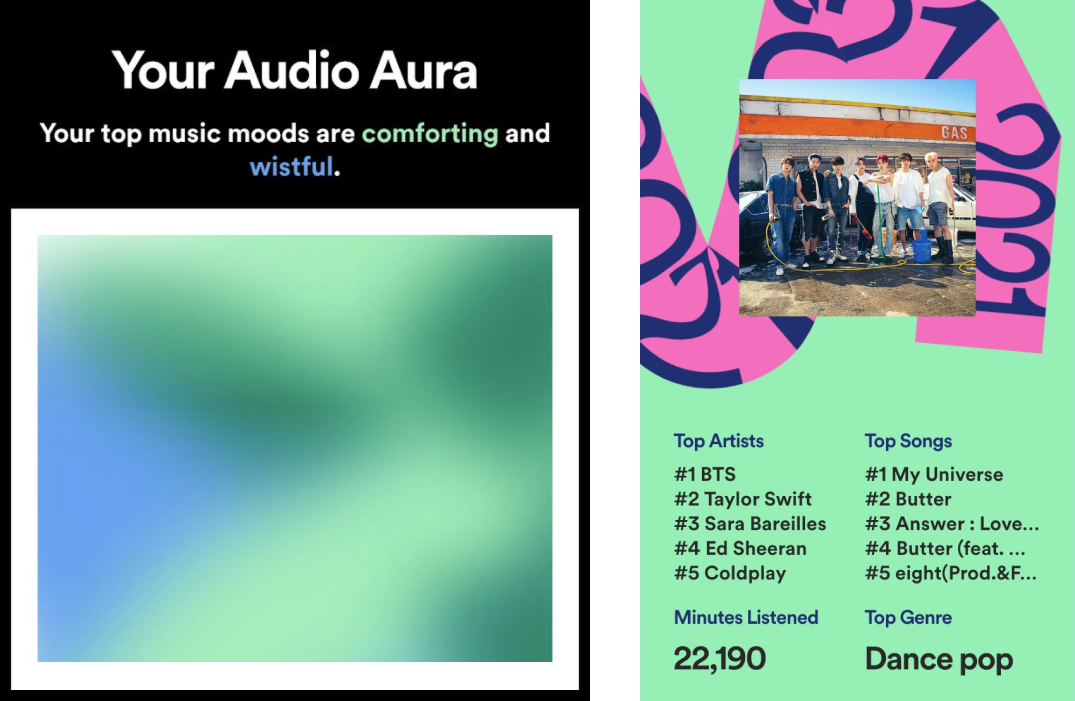
Spotify, who made 'Wrapped' a thing. You get the data at the year, usually with some whimsical copy and them taking a shot at figuring out your personality based on your music tastes 😐 It's always at the end of November though, and I still don't know if that means they count the data from November → November, or just January → November for the year??
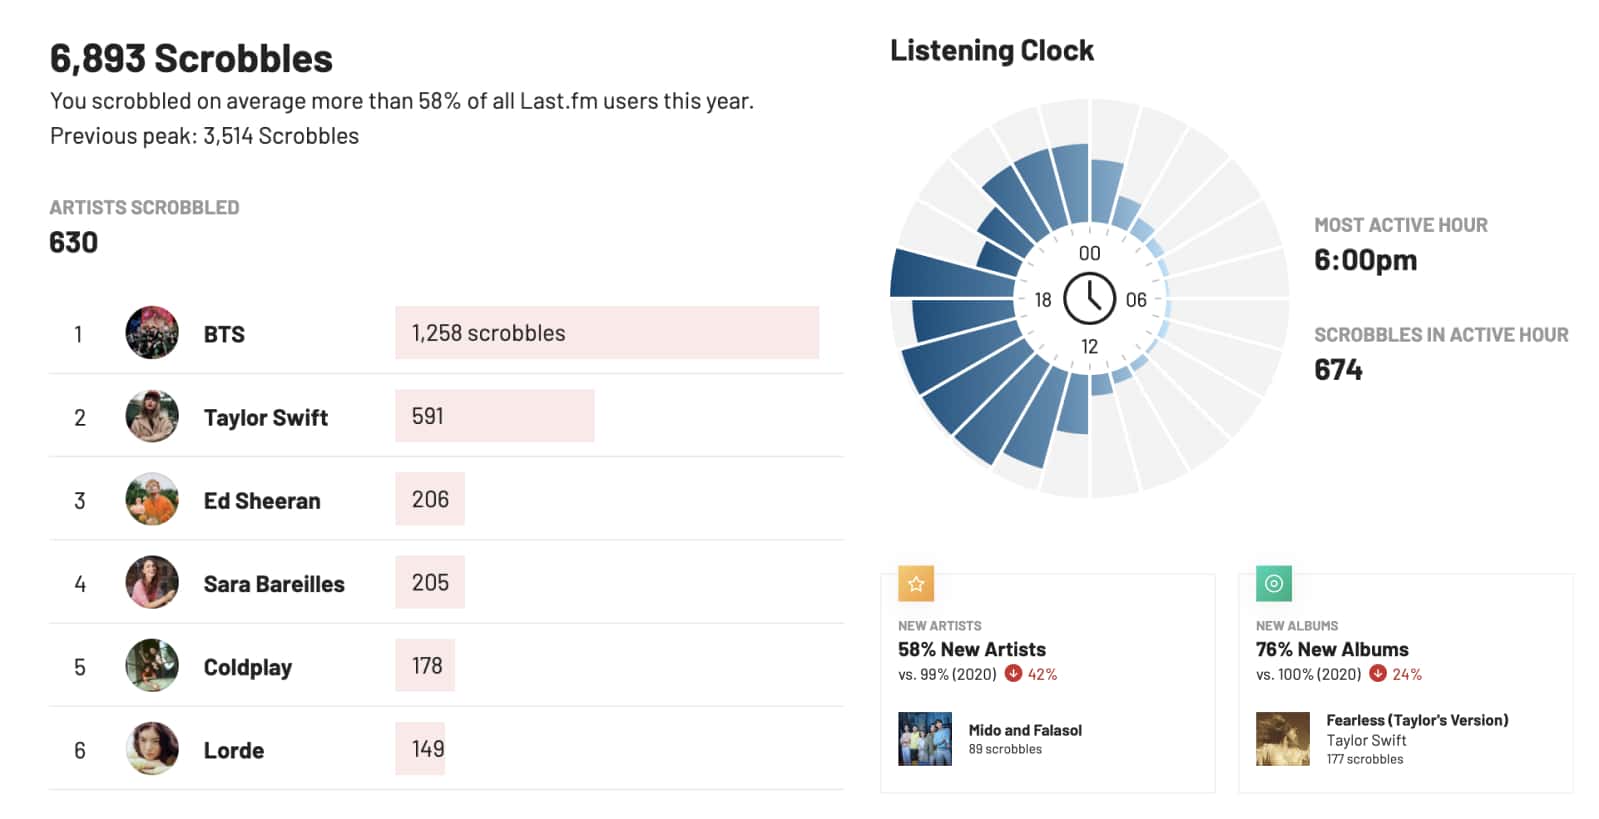
Last.FM is great if you use multiple music apps as they integrate with most of them! I only connect my Spotify account but even then, it helps me make sense of Spotify's Wrapped data. Like at least I know how far ahead BTS is against all the other artists in 2021 😆 They also give other fun data like your most active day of the week or time of the day.
And! Unlike Spotify, they give you stats for January → December.
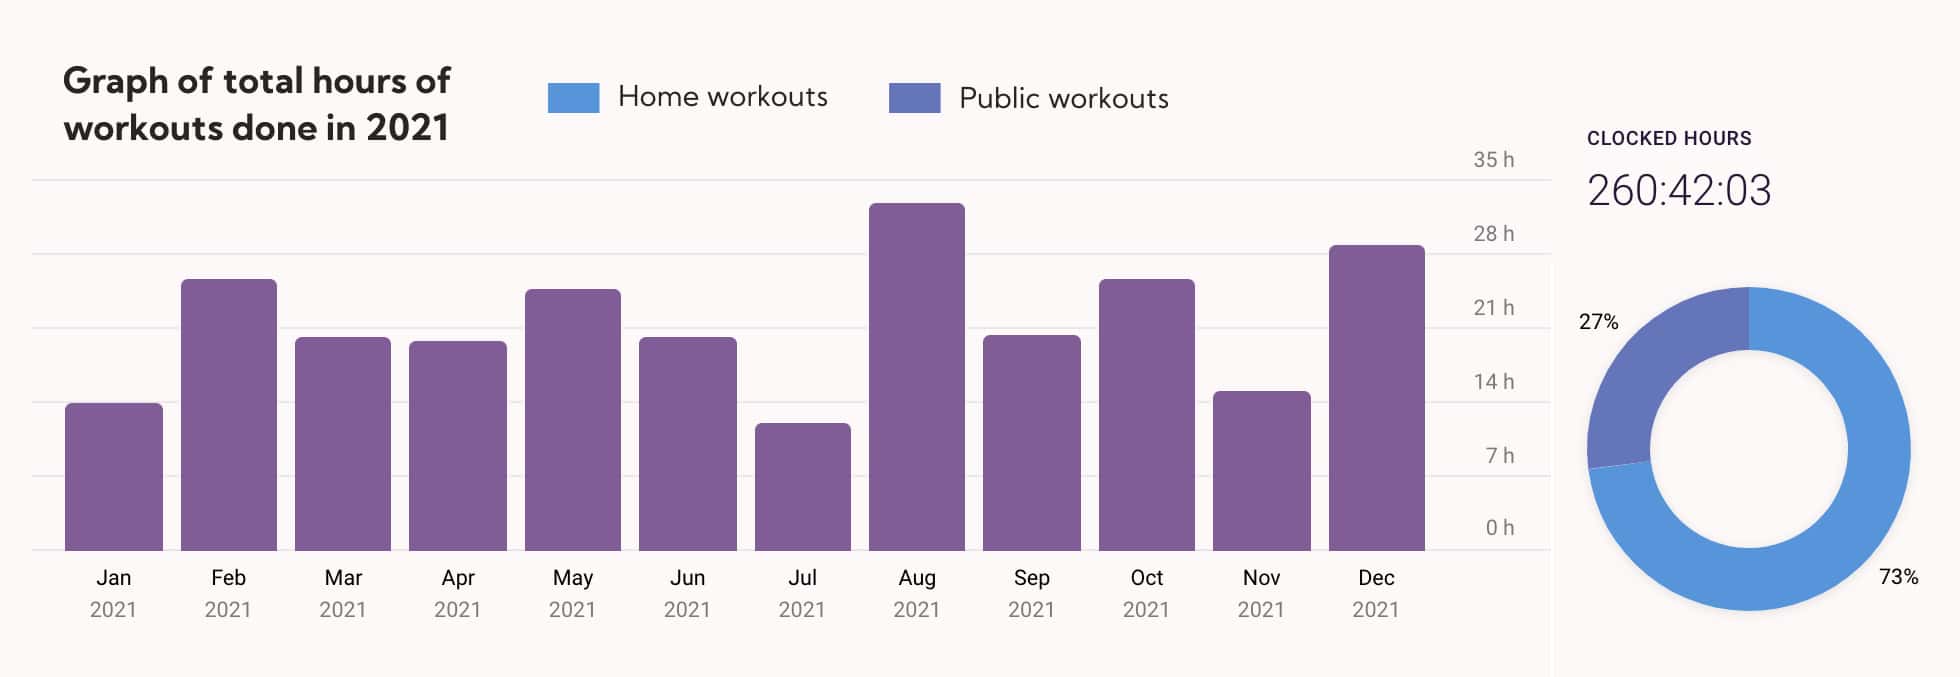
Toggl Track for time tracking
I'm a huge fan of time tracking! I track time for hobbies, sports and personal video calls. At the end of the year, I export an (like I said, ugly) CSV file for all the data tracked for the year... but hey, at least it's free. I'd still need to do some data-crunching myself but they are just simple formulas in Excel.
Not sponsored by Toggl Track. I work there, but the only advantage I have is that I get to whine to colleagues about having to do some data-crunching myself when it could have been included in the report.
Strava for running
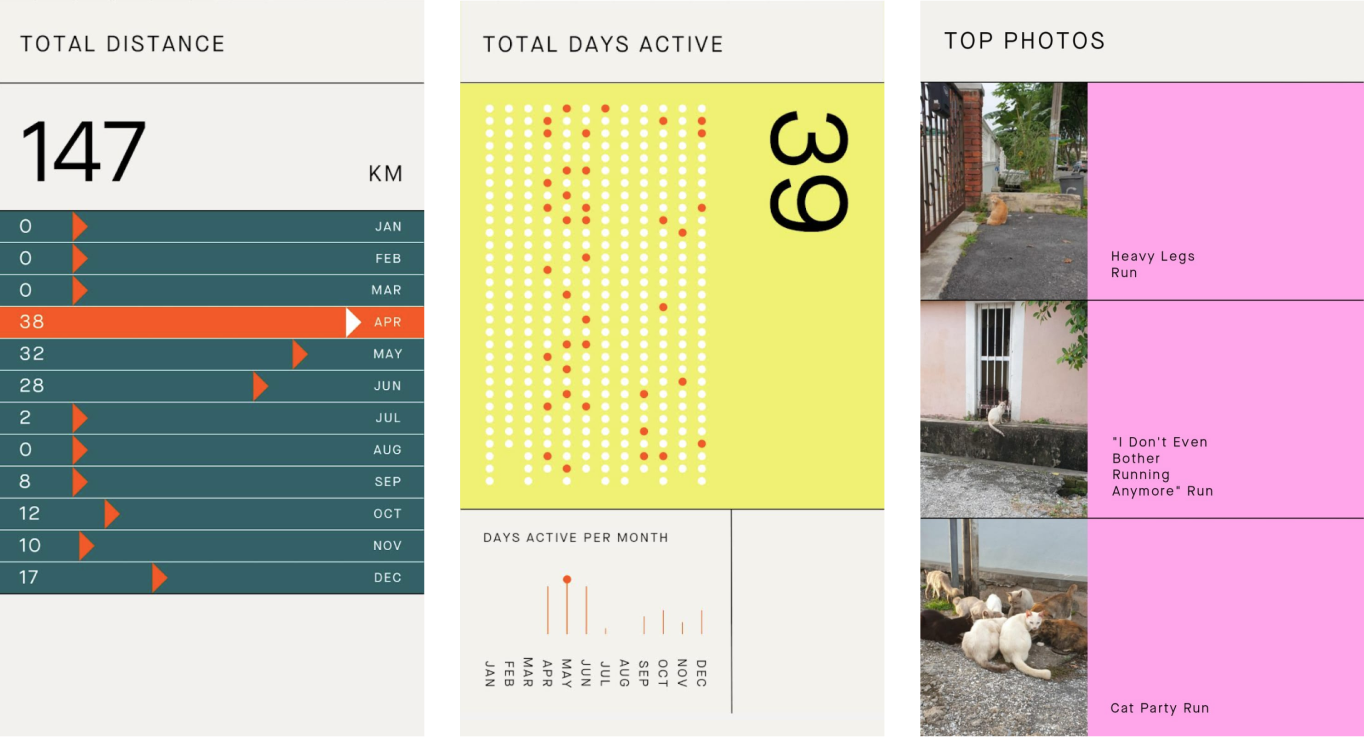
You can also track cycling and swimming stats with Strava. I can live peacefully without all this data (I use Strava to share cat photos) but I guess it's pretty cool!
This was a surprise and somewhat random. But sure, I guess I don't mind celebrating my scrolling capabilities.
FAQ
Is this time-consuming?
I can promise you that it isn't! It can be a bit awkward to try and get used to the template format for the first few days, but after that, it's a breeze and you'll only need maybe a minute two or three times a day—I do it just before I start work, mid workday and maybe another time at the end of the day.
You can even manage by doing once at the end of the day if you trust your good memory.
I can tell you what is time-consuming as hell though: Creating graphics if you want to showcase them in a specific format.
For example, every year, I choose 5 interesting stats/insights and explain them via Instagram stories for fun.
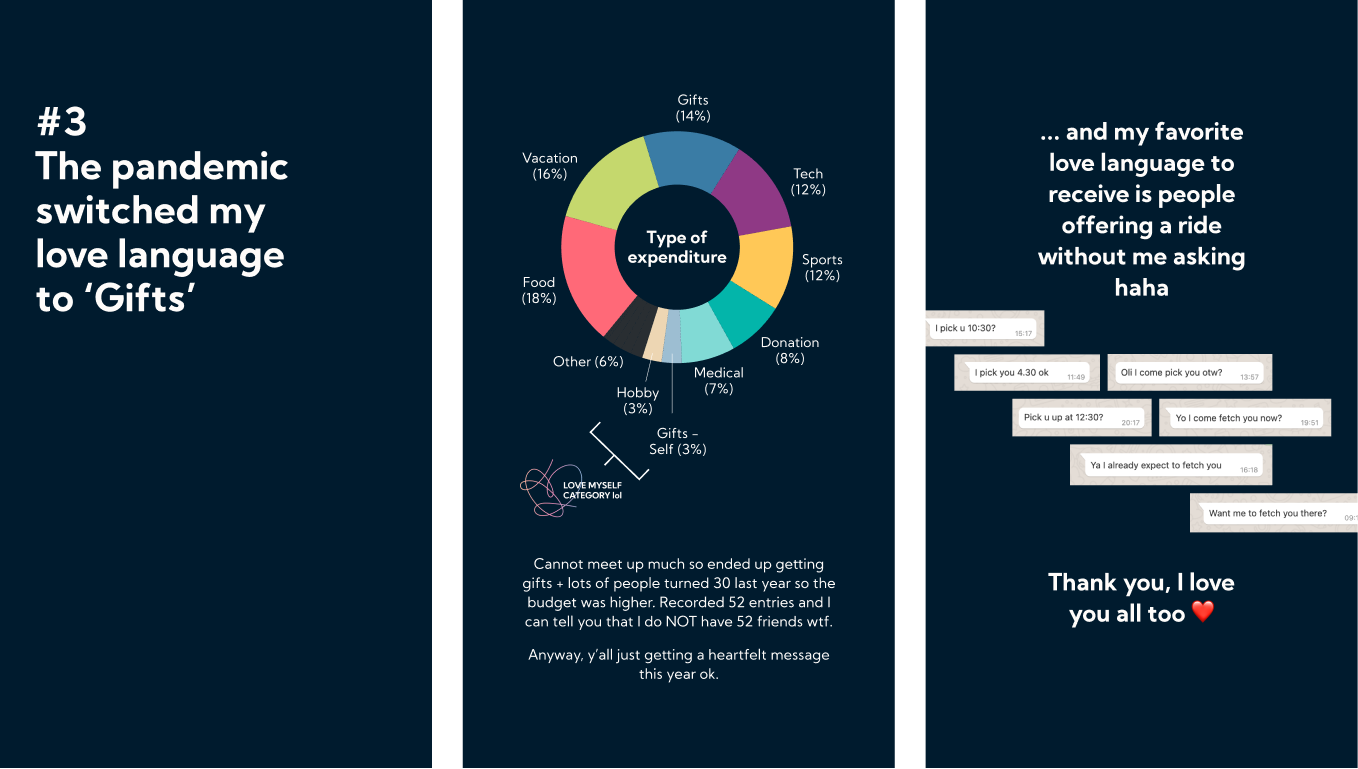
It's like a mini content strategy project lol.
I still want to create pretty graphs despite your warning. What software do you use?
I use Figma and this Chart plugin (paid). However, you can also create the graphs in Google Sheets itself since the data is already in there. I only chose Figma because I'm very comfortable with it as I use it for work and I needed a more powerful software to create additional graphics for the Insta stories and the blog post.
Isn't this whole thing a waste of time?
That's just like, your opinion man.